Posts

GIS Programming: Working with Rasters
Image
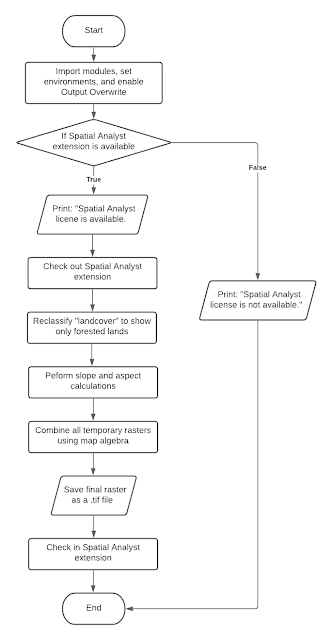
Rasters are one of the two primary data models used in GIS. While vectors use points and line segments to identify locations on Earth, rasters define space using a matrix of equally sized cells. Two modules included within the ArcPy package allow access to many geoprocessing tools designed to work with raster data and imagery, which is a specific type of raster data. These modules are the Spatial Analyst ( arcpy.sa ) and Image Analyst ( arcpy.ia) modules.  Our task for this week's lab was to write a script that creates an output raster layer identifying areas that fall within a given set of parameters regarding slope, aspect, and land cover class. More specifically, the output layer had to identify areas with the following characteristics:  Forest land cover (classifications 41, 42, and 43) Slope between 5°and 20° Aspect between 150°and 270° Below is a flowchart which outlines the various steps of the script. One challenge I had while writing the script was trying to assign b...

GIS Programming: Working with Geometries

Image
Points, lines, and polygons are all examples of geometry objects. Each of these geometries consist of one or more vertices, or pairs of x,y coordinates. Understanding how to read existing geometry objects and how to create new geometry objects using the ArcPy package within Python provides detailed manipulation of features and the vertices of which they are composed.  Our task for this week's lab was to write a script that creates a .txt file and writes to it the Object ID, Vertex ID, x - y coordinates, and the name of the feature associated with each vertices contained within a shapefile called "rivers.shp".   Pseudocode is a plain language description of the steps within a program or algorithm. Writing out the pseudocode before attempting to write the actual script can be helpful in developing and understanding the structure or outline of the script. Below is an example of pseudocode for the script in this week's lab.  Start           ...

GIS Programming: Exploring and Manipulating Data

Image
Two of the most common methods for exploring data are through the Describe() function and the ListFeatureClasses() function within the arcpy package. The  Describe() function allows one to explore the properties of a particular dataset, such as data type, file path, base name, etc., and  the  ListFeatureClasses()  function creates a list of all feature classes within the current workspace. Tabular and spatial data can be manipulated with the use of cursors, which allow one to iterate over the records in a table or insert new records. There are three types of cursors, namely search cursors, insert cursors, and update cursors.  In this weeks lab, we used the  ListFeatureClasses()  and  Describe()  functions to copy all the features in our Module 4 Data folder into a new file geodatabase. We then used a search cursor to locate all the county seats of New Mexico within the "cities" feature class and printed the name, population, and featu...

GIS Programming: Geoprocessing with Python

Image
One of our tasks for this week's lab was to write a Python script using the Spyder IDE to execute the following geoprocessing objectives on the provided hospitals shapefile :  Add XY Coordinates to the hospitals shapefile Create a 1000 meter buffer around the hospital feature Dissolve the hospital buffers into a separate, single feature My thought process for completing these objectives is outlined in the following steps:  First, I imported the ArcyPy package, set the workspace environment to my Data folder within the Module 3 folder (S:/GISProgramming/Module3/Data), and enabled geoprocessing outputs to be overwritten. For adding the XY coordinates to the hospitals shapefile, I ran the AddXY_management() tool using the hospitals shapefile as the input parameter. I then used the GetMessages() function to print out the messages from this tool.  For adding the 1000 meter buffer around the hospitals, I ran the Buffer_analysis() tool using the hospitals shapefile as the input...

GIS Programming: Debugging and Error Handling

Image
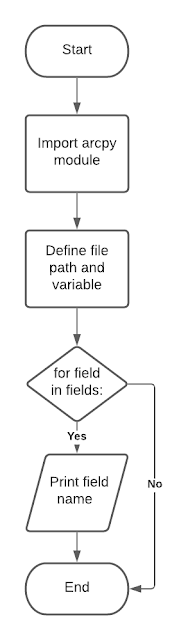
"At the source of every error which is blamed on the computer you will find at least two human errors,  including the error of blaming it on the computer." ~Anonymous The art of debugging is arguably one of the most important skills for any programmer. Procedures for debugging include:  Reviewing error messages  Inserting print messages at select locations within the script Commenting out lines or sections of code Using a debugger  Our task for this week's lab was to debug two pre-written scripts using some of the above procedures and add a try-except statement to a third script to catch the error.  Script 1 Script one contained two errors and/or exceptions that needed to be fixed in order for the script to run. Once fixed, the script printed out the names of all fields within the parks.shp attribute table.  Flowchart for Script 1. Script 1 output.  Script 2 Script 2 contained several errors/exceptions that needed to be corrected in order for the scri...

GIS Programming: Python Fundamentals

Image
This week's lab provided a solid introduction to the fundamentals of programming in Python, working within an IDE, and setting up file paths to manage data and outputs for the remainder of the course. In Step 1 of the lab, we learned how to work with strings and lists by splitting our full name into a list of strings. We then used indexing to print our last name, the last item in the list. In Step 2, we learned some of the basics of debugging by fixing two errors in a prewritten dice game program. Steps 3 and 4 had us create a list of 20 random numbers and then remove a chosen integer from the list.  The screenshot below shows my outputs for these steps. 

Google Earth: Tour of South Florida

Image
Google Earth is a great way to share geospatial data with users who may not have the knowledge base or software to otherwise access GIS data. In this lab, we learned how to convert shapefiles and feature classes into .kml files within ArcGIS pro so that these files can be easily added to Google Earth. We also learned how to create and share a virtual tour within Google Earth.   The map below was created in Google Earth and shows water features and population densities of South Florida. The data was first converted to the .kml format in ArcGIS Pro and then added to Google Earth. The legend was added as an image overlay.  The video below shows the virtual tour I created within Google Earth highlighting several metropolitan areas in South Florida.