GIS Programming: Working with Geometries
Points, lines, and polygons are all examples of geometry objects. Each of these geometries consist of one or more vertices, or pairs of x,y coordinates. Understanding how to read existing geometry objects and how to create new geometry objects using the ArcPy package within Python provides detailed manipulation of features and the vertices of which they are composed.
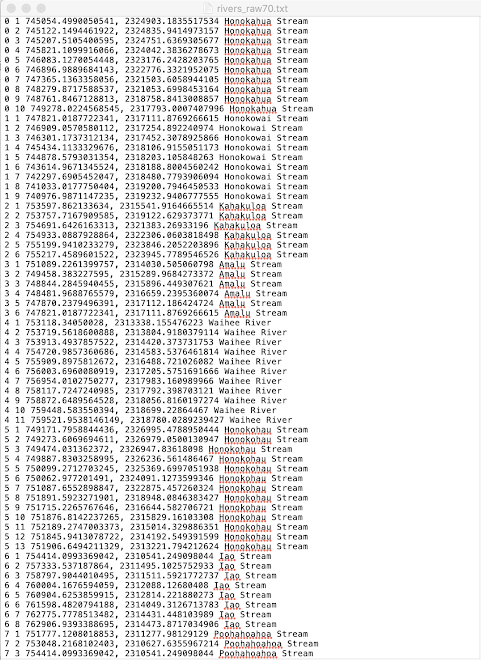
Our task for this week's lab was to write a script that creates a .txt file and writes to it the Object ID, Vertex ID, x - y coordinates, and the name of the feature associated with each vertices contained within a shapefile called "rivers.shp".
Pseudocode is a plain language description of the steps within a program or algorithm. Writing out the pseudocode before attempting to write the actual script can be helpful in developing and understanding the structure or outline of the script. Below is an example of pseudocode for the script in this week's lab.
Start
Import ArcPy package
Set environment workspace
Create/open “rivers_raw70.txt” file
Create search cursor for “rivers.shp”
For each feature/row in the cursor
Set Vertex ID number to zero
For each point/vertex in a feature/row
Increment Vertex ID by one
Write OID, Vertex ID, X coordinates, Y coordinates, and Feature Name to “rivers_raw70.txt”
Print OID, Vertex ID, X coordinates, Y coordinates, and Feature Name
Delete row
Delete cursor
Close “rivers_raw70.txt”
End
- Object ID
- Vertex ID
- X Coordinates
- Y Coordinates
- Feature Name


Comments
Post a Comment