GIS Programming: Working with Rasters
Rasters are one of the two primary data models used in GIS. While vectors use points and line segments to identify locations on Earth, rasters define space using a matrix of equally sized cells. Two modules included within the ArcPy package allow access to many geoprocessing tools designed to work with raster data and imagery, which is a specific type of raster data. These modules are the Spatial Analyst (arcpy.sa) and Image Analyst (arcpy.ia) modules.
Our task for this week's lab was to write a script that creates an output raster layer identifying areas that fall within a given set of parameters regarding slope, aspect, and land cover class. More specifically, the output layer had to identify areas with the following characteristics:
- Forest land cover (classifications 41, 42, and 43)
- Slope between 5°and 20°
- Aspect between 150°and 270°
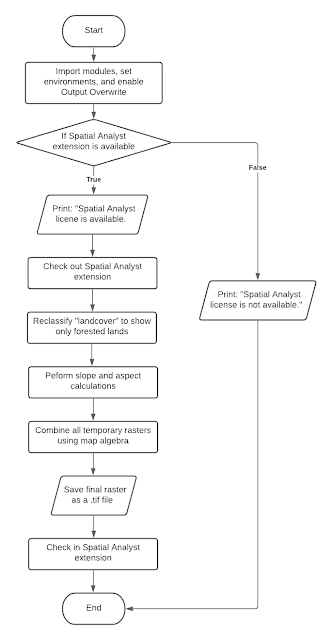
Below is a flowchart which outlines the various steps of the script.
One challenge I had while writing the script was trying to assign both the upper and lower limits of the slope and aspect calculations to a single variable (i.e., goodSlope and goodAspect) using the logical and operator in the following lines of code:
goodSlope = (slope >= 5) and (slope <= 20)
goodAspect = (aspect >= 150) and (aspect <= 270)
This resulted in the following error:
ValueError: The truth value of a raster is ambiguous. Invalid use of raster with Boolean operator or function. Check the use of parentheses where applicable.
To resolve this issue, I ended up having to assign the maximum and minimum slope and elevation to two separate variables as explained in the lab instructions, resulting in four total variables as follows:
goodSlopeLow = slope >= 5
goodSlopeHigh = slope <= 20
goodAspectLow = aspect >= 150
goodAspectHigh = aspect <= 270
Below is a screenshot of the output raster result from my successful script. The areas meeting the slope, aspect, and land cover class criteria are shown in red.
The following is a screenshot of the results of my script shown in the IPython Console within Spyder.


Comments
Post a Comment